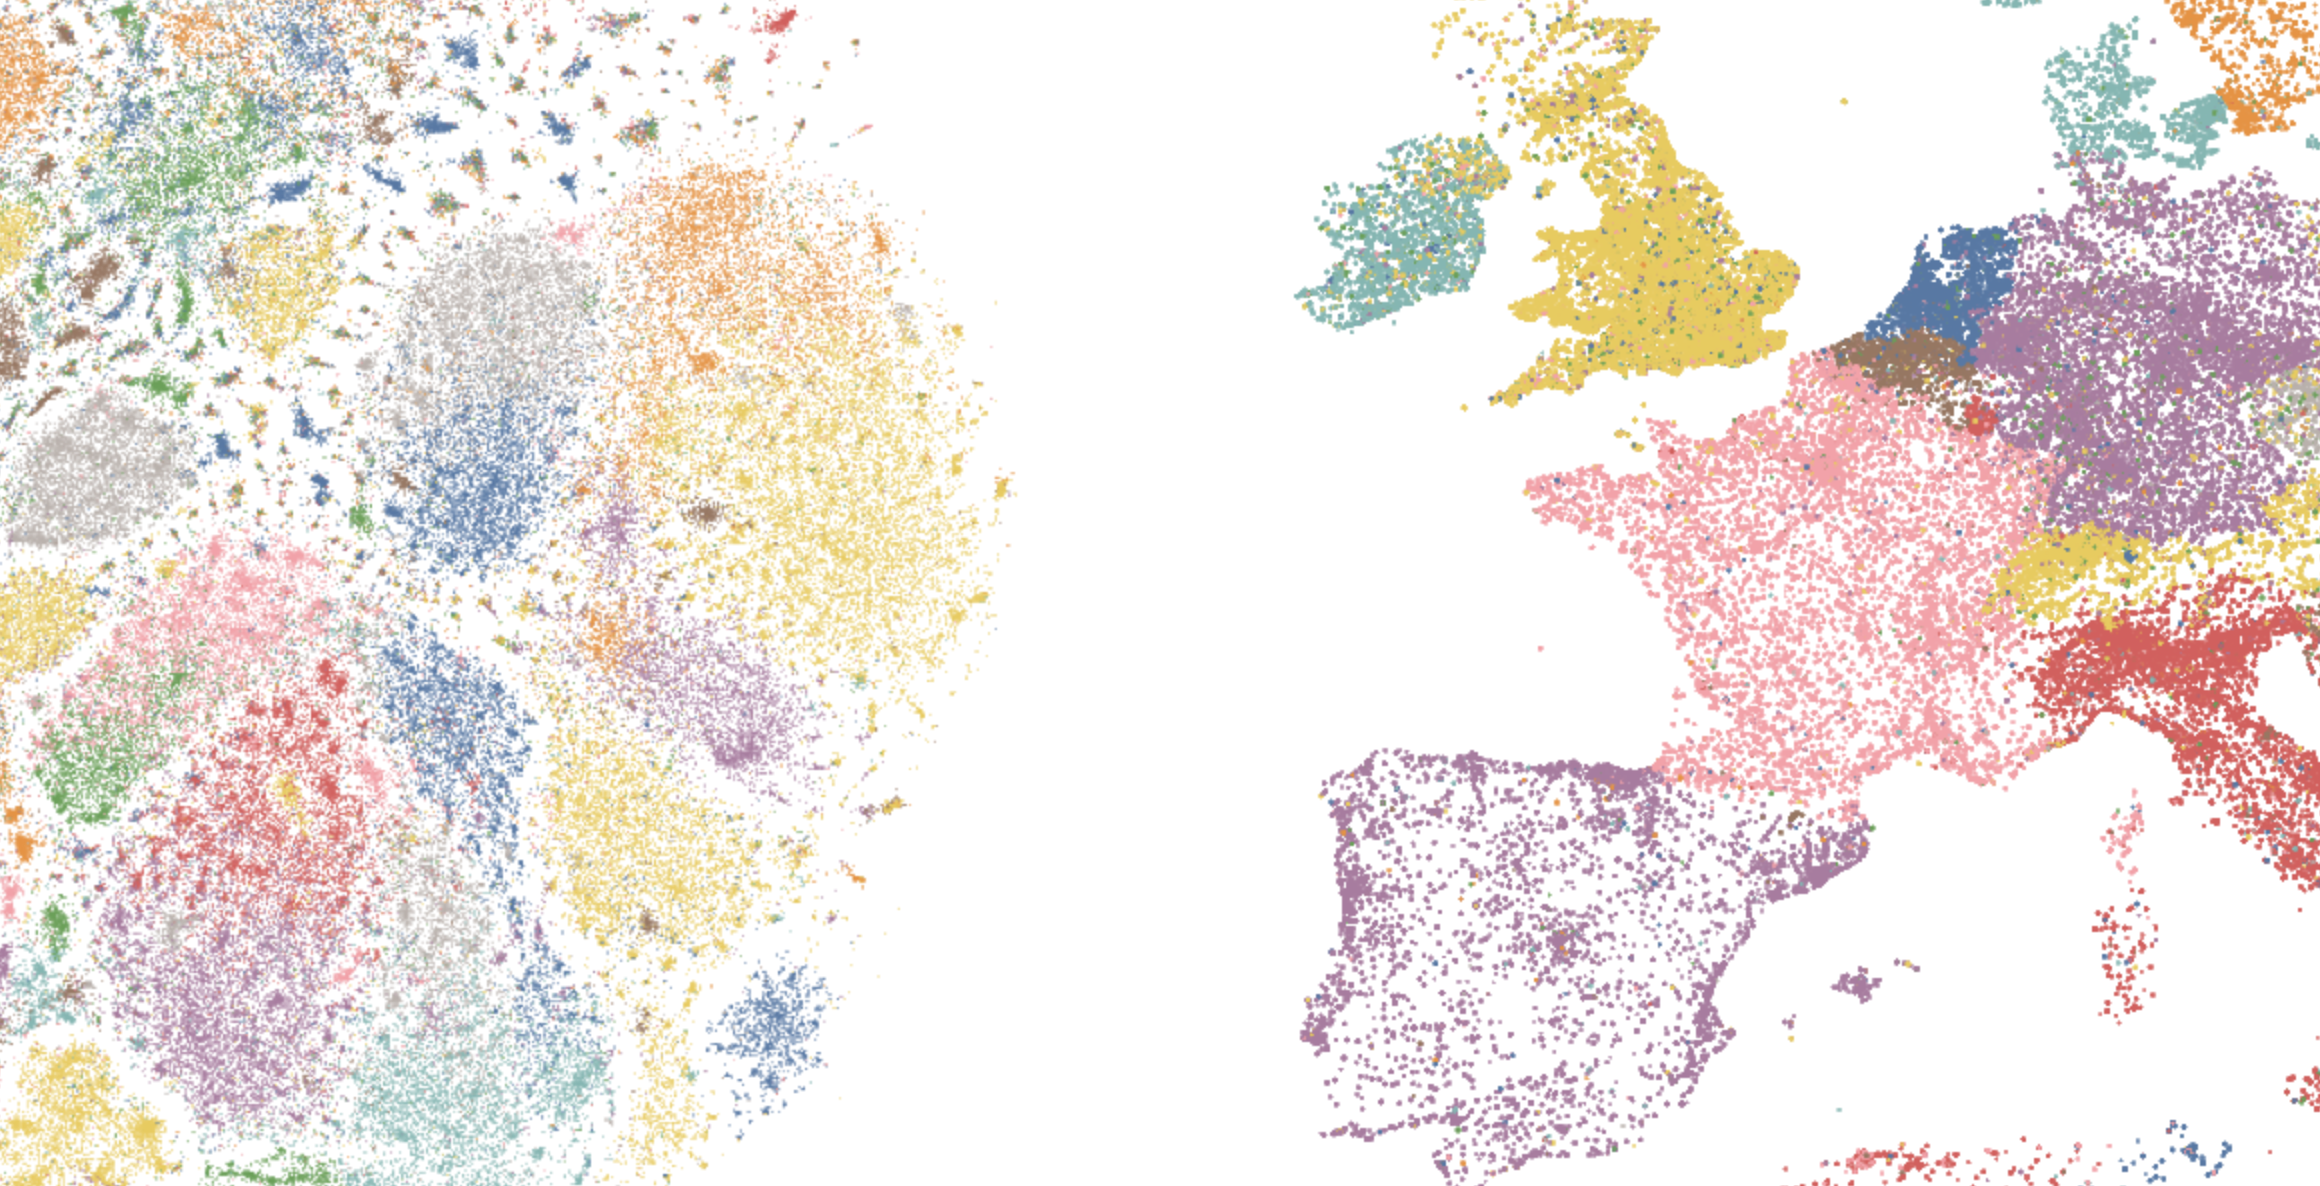
Nomic Atlas gives shape to your unstructured data with our custom embedding and projection models, but sometimes you have information of your own that you want to investigate on your Atlas map. Today we're providing a new capability to Atlas — reorienting the map around your own coordinates.
When you create a dataset through our Python client or web upload, you can now include column pairs of XY coordinates, or latitude and longitude. For full details on how to structure and name these columns, see our documentation.
Here at Nomic, we find multiple positioning schemes to be a powerful tool for understanding our own embeddings. Our flagship embedding model, nomic-text-embed-v1.5, is built with support for variable-sized embeddings. This means you can truncate embeddings to reduce storage and compute cost with only a slight performance loss.
In order to understand how these different embedding sizes influenced the semantic representations, we embedded 100,000 Wikipedia articles, created projections at the different sizes, and uploaded them all to the same Atlas map.
When comparing models of different types and sizes, performance benchmarks can only tell you so much. Model properties like the one described above may go completely unnoticed in traditional testing, but have large repercussions on model performance in production. Nomic Atlas offers a unique and powerful path to better understanding the true nature of an embedding model.
The most common form of positional data is geospatial coordinates, or Latitude/Longitude. A large number of domains work with geospatial data every day, and allowing Atlas users to explore the semantic world alongside the physical world is a crucial goal for us.
To showcase the power of geospatial in Atlas, we used the excellent dataset of 2.2 million cross-verified people for which Wikipedia entries exist. This dataset contains an incredible amount of high-quality structured data regarding birth and death, occupation, nationality, and more. It also contains latitude and longitude for birth and death (if they exist and are known).
With birthplace and deathplace available as separate geospatial positions, we can visualize not just the semantic landscape of people, but their existence in the real world over their lives.
Further, we can combine our filter tools with the geospatial positions to get powerful selection capabilities.
For instance, what if we wanted to find all the actors and artists that were born in the greater London area, and died in the LA area? With geospatial positioning, the lasso tool, and combined selections, we can create such a filter in seconds. We can then see where those articles fall in the embedding space.
We are excited to see what you put together with these new capabilities in Nomic Atlas. Sign up for a free account today, and reach out to us if you have questions or have a map worth showcasing.